DEM Elevation Accuracy: The Reality Check Tool
DEM Elevation Accuracy Checker: Click Any Point on the Map
Click any point on the map to check DEM elevation accuracy against three independent free sources at once, and see the 30 m pixel each value comes from.
How Much These Disagree Right Now
Survey-Grade vs DEM-Grade Calculator
Enter the vertical accuracy your project actually needs, such as a differential level run or a total station trigonometric height, and see how many times coarser a typical open DEM is by comparison.
Based on a representative 7.5 m open-DEM vertical uncertainty, the mid-point of the commonly published 5 to 10 m LE90 range for global 30 m SRTM/ASTER class DEMs. Actual uncertainty at any single pixel can fall outside this range depending on terrain and canopy cover, this is a general published figure, not a guarantee for a specific location.
One elevation value from a free DEM API represents everything inside a roughly 900 square metre cell, the box drawn on the map above. On an actual Indian road or drainage alignment, that single cell can span a full carriageway, a lined drain, a kerb, and two or three metres of natural ground fall, all averaged into one number. A grade design cannot be built on an average, it needs the true elevation at each specific chainage.
| Source | Underlying Dataset | Nominal Grid | Typical Vertical Accuracy | Best Use |
|---|---|---|---|---|
| Open-Meteo Elevation API | Global SRTM/Copernicus derived blend | Large-area grid, varies by tile | Published range 5–10 m LE90 for open global DEMs | Quick approximate lookup |
| OpenTopoData SRTM 30m | SRTM v3 | ~30 m per pixel | Published range 5–10 m LE90 | Reconnaissance, catchment scale |
| OpenTopoData ASTER 30m | ASTER GDEM v3 | ~30 m per pixel | Published range 5–10 m LE90, noisier over flat ground | Cross-check against SRTM |
| Differential Level / Total Station | Direct field observation | Single surveyed point, not gridded | Typically 2–5 mm | Grade-design elevation |
DEM Elevation Accuracy Breaks Down at Design Scale
DEM elevation accuracy looks impressive on screen until you need it to hold a number for construction. Every value returned by a free elevation API is an average over roughly a 900 square metre cell, the 30 m by 30 m block drawn on the map above. That single cell can contain a full road cross section, a lined drain, a kerb line, and two or three metres of natural fall, all compressed into one figure. Open SRTM and ASTER class datasets carry a published vertical uncertainty commonly cited in the 5 to 10 metre LE90 range, depending on terrain and canopy cover. A road or drainage design routinely needs to hold grade to a few millimetres over a run of only a few metres.
Where Field Leveling Still Wins
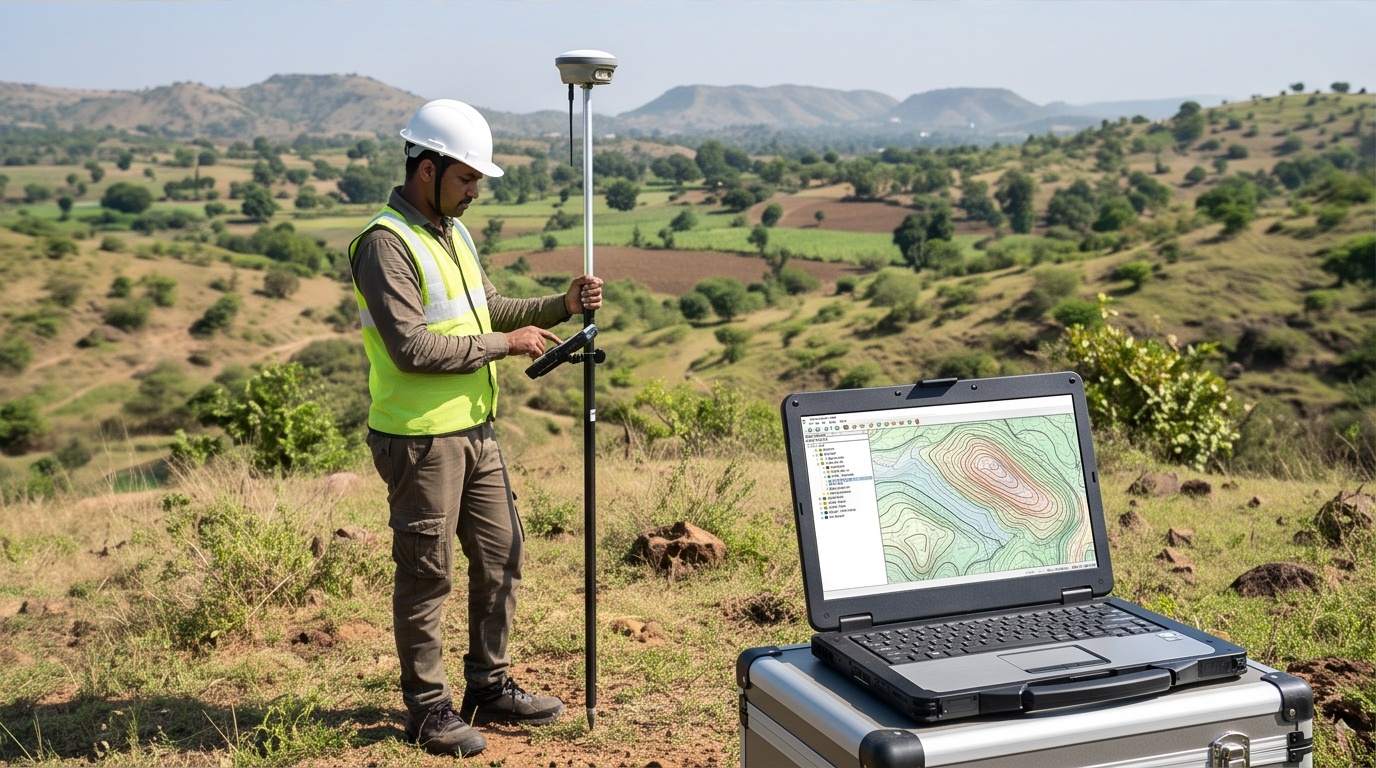
That gap is why differential leveling and total station trigonometric heighting remain the only route to grade design elevation. A proper construction survey ties every point to a benchmark with a closed level run, not an averaged pixel. DEM data earns its place earlier in a project, for reconnaissance, catchment shape, and rough cut and fill estimates, where a metre or two of uncertainty barely matters. Once concrete needs to be poured to level, the tool that placed a pin on a satellite map hands off to a crew with a staff and a level.