Technology

GIS Dashboard

Custom web or desktop GIS dashboards for real-time project monitoring, spatial data visualization, and asset management — built on ArcGIS, QGIS, or web platforms.

Equipment usedDocumentation, GIS
DeliverableCustom Dashboard
About this technology

What we deliver, and how

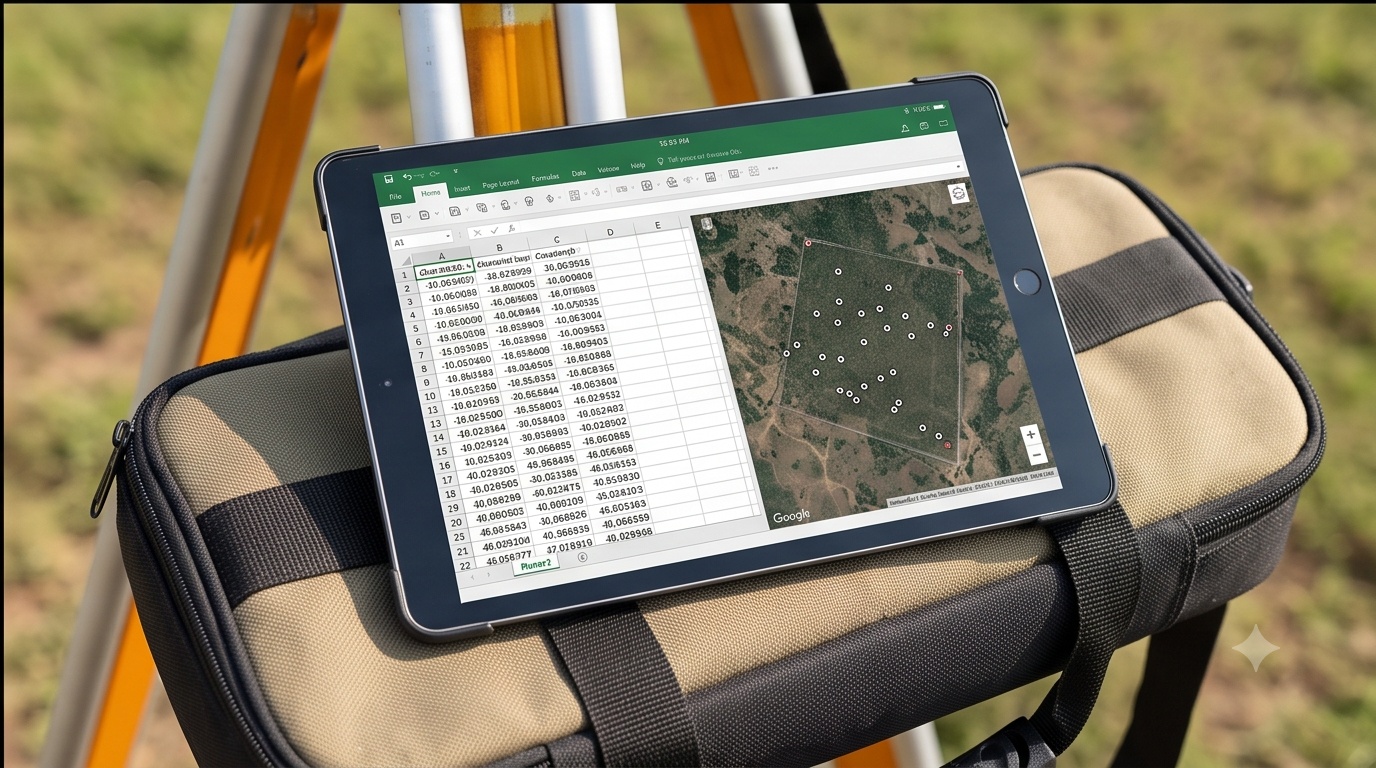
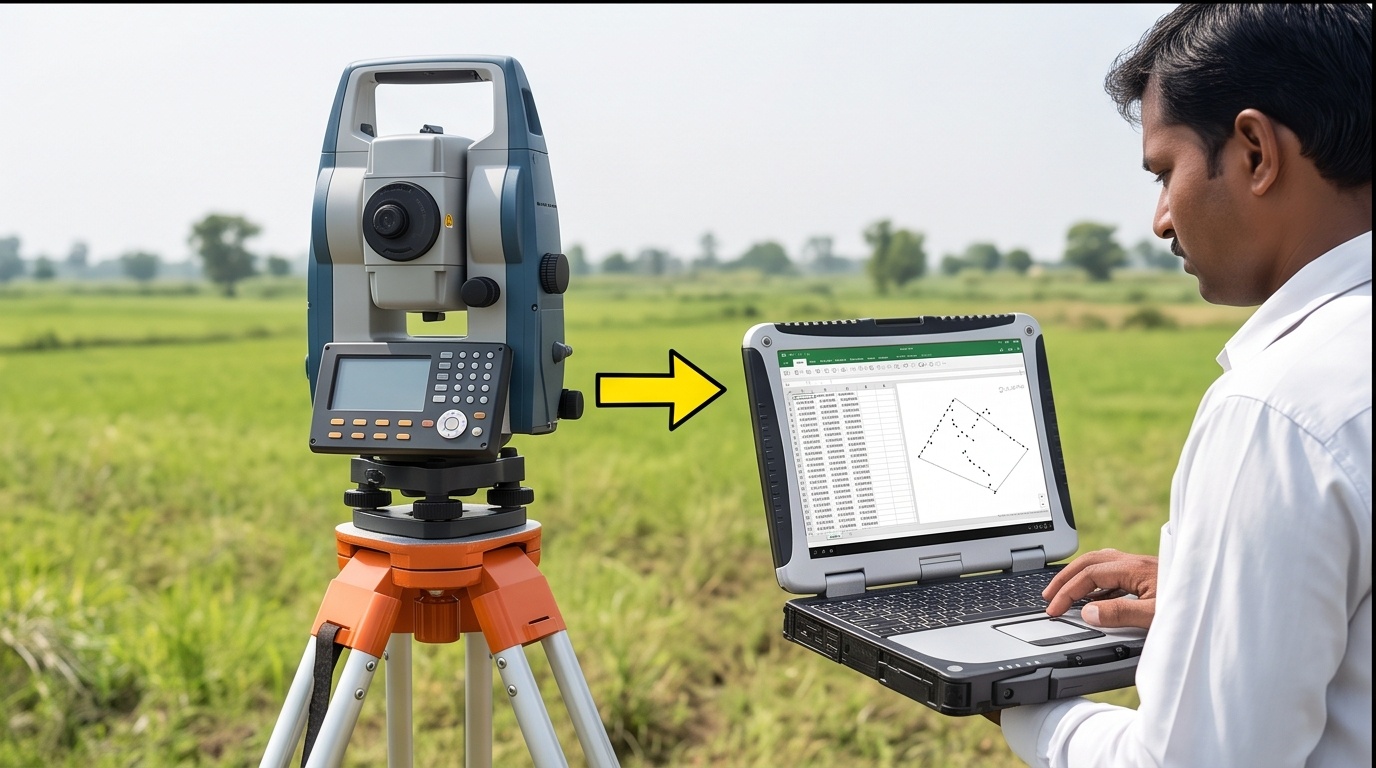
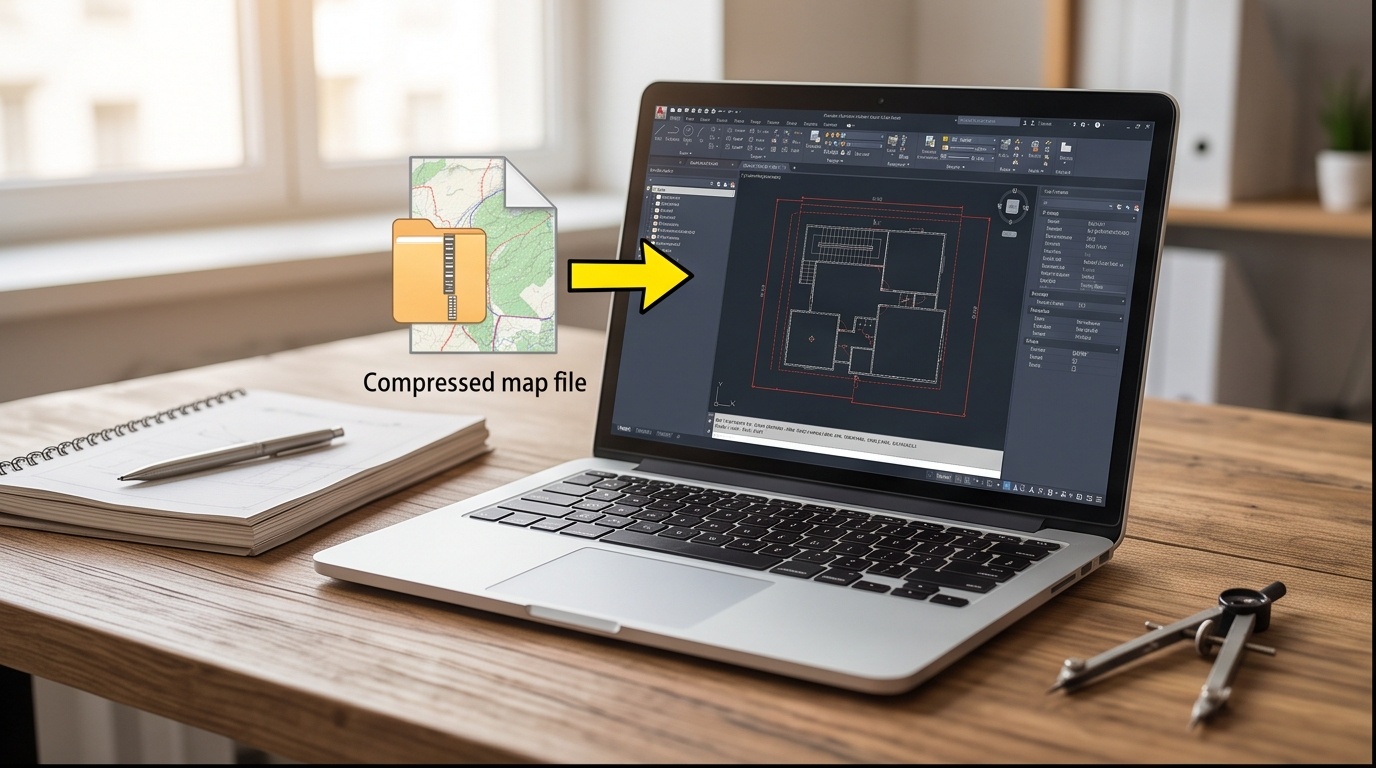
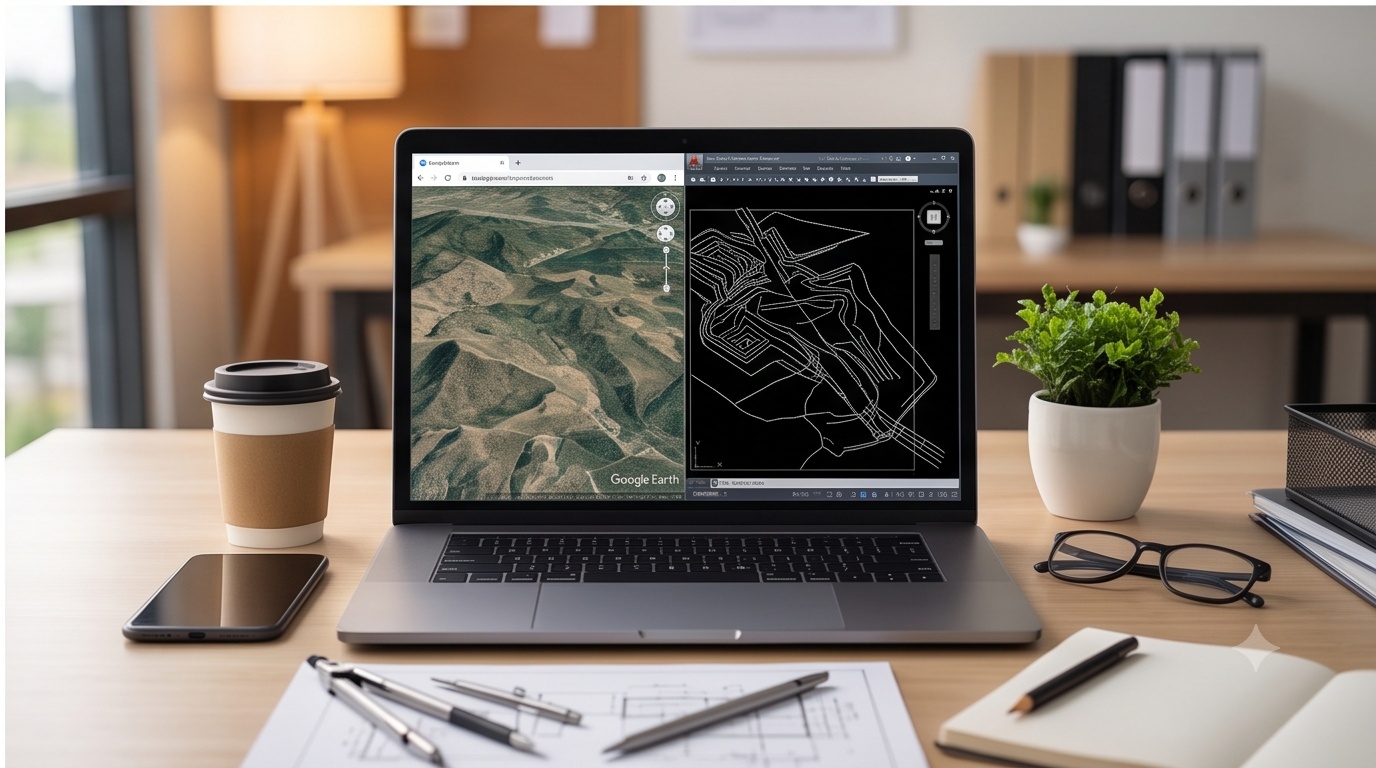

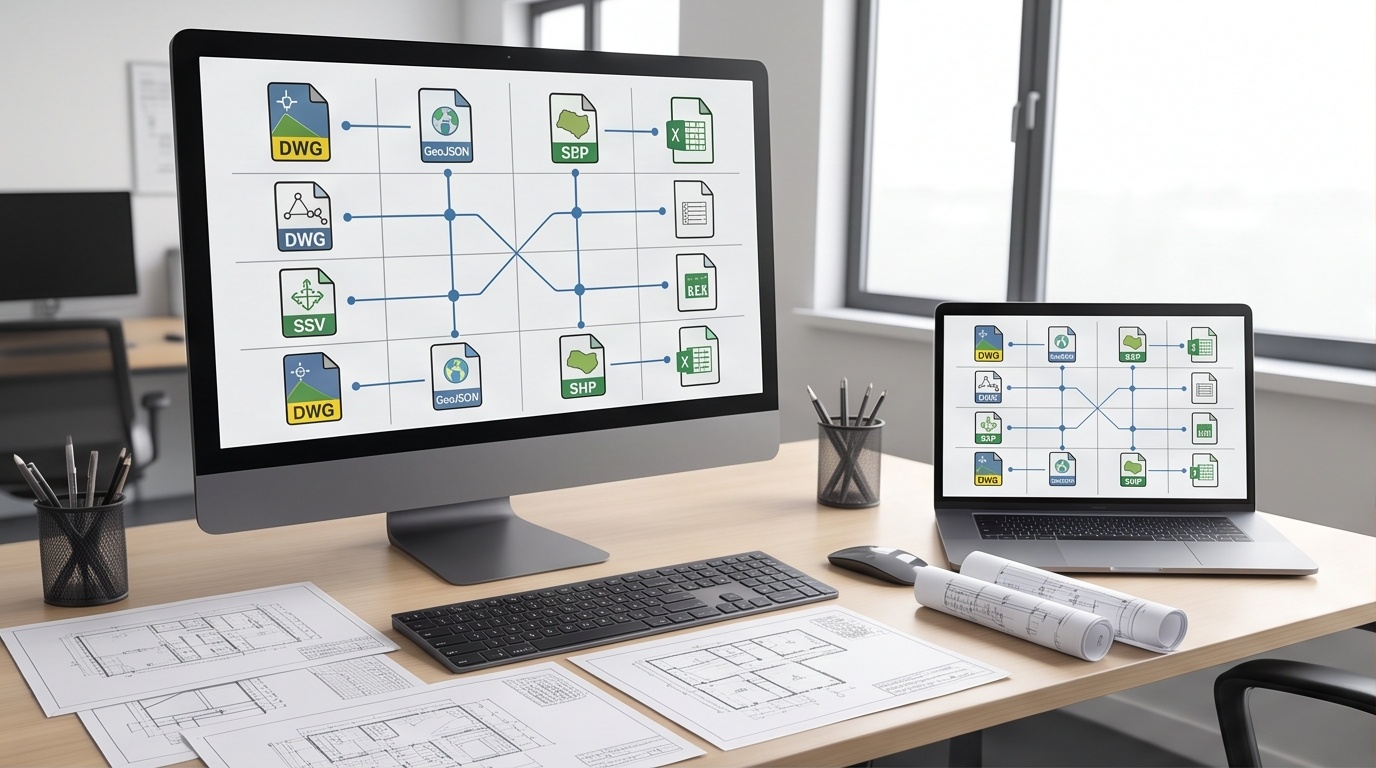
A GIS dashboard turns raw survey and project data into an interactive, browser- or desktop-based visualization tool — built on platforms like ArcGIS or QGIS, or as a custom web application — so stakeholders can explore spatial data, track project status, and pull reports without needing GIS software expertise themselves.

Trishunya builds these for real-time infrastructure project monitoring across multiple sites, smart-city asset management portals, utility network visualization for maintenance planning, and structured reporting dashboards for government and PSU clients who need to track progress against a defined format.

Common applications

Where this is used

Blogs on this topic

Further reading

Start a project

Get a same-day quote for GIS Dashboard

Send us your site location and requirement — we respond on WhatsApp within working hours, anywhere in India.

Field photos from current GIS Dashboard projects are being added — sample outputs are available on request over WhatsApp.