የባቲሜትሪክ ካርታዎችን እና የጥልቀት ኮንቱር መስመሮችን መረዳት
የባቲሜትሪክ ካርታ የተገለበጠ የመሬት አቀማመጥ ካርታ ይመስላል። በመሬት ላይ እኩል ከፍታ ያላቸውን ነጥቦች ከሚያገናኙ መስመሮች ይልቅ፣ እዚህ ያሉት የኮንቱር መስመሮች ከውሃ በታች እኩል ጥልቀት ያላቸውን ነጥቦች ያገናኛሉ፣ እና በትክክል ማንበብ አጠቃላይ የውሃ ውስጥ የመሬት ገጽታን በጨረፍታ ያሳያል።
የተቀራረቡ የኮንቱር መስመሮች ቁልቁል ቁልቁለት ማለት ነው። ሰፋ ያሉ መስመሮች ደግሞ ለስላሳ ተዳፋት ያሳያሉ። ይህንን መሰረታዊ ስርዓት አንዴ ከተረዱ፣ የባቲሜትሪክ ካርታ ከውሃው ወለል በታች ያለውን ነገር በግልጽ የሚያሳይ ምስል ይሆናል።
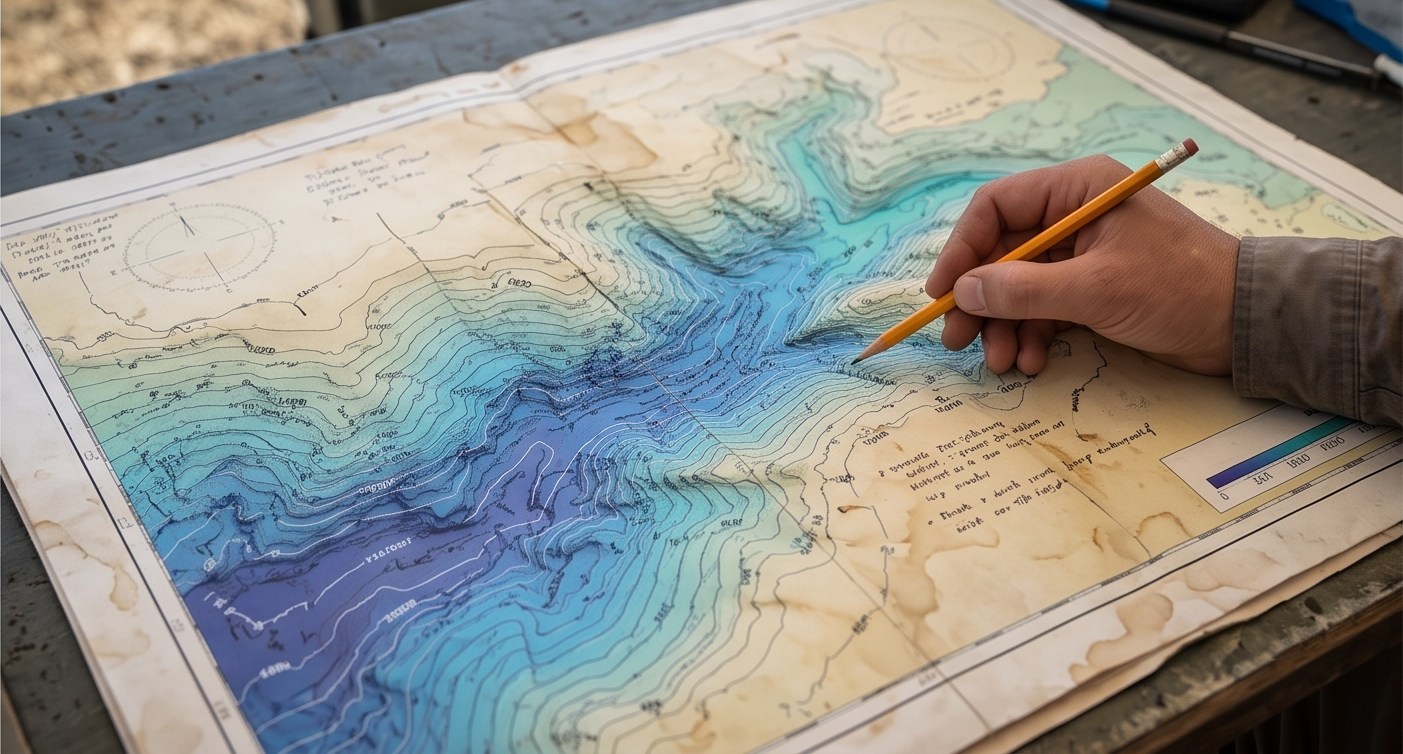
መስመሮች ከመረጃ ሲፈጠሩ ይመልከቱ
የቀጥታ ኮንቱር ምስረታ
የባቲሜትሪክ ካርታ ማንበብን ይለማመዱ
ተግባራዊ የጥልቀት አንባቢ
የኮንቱር ዝርዝር ደረጃን ያስተካክሉ
የኮንቱር ልዩነት ማስመሰያ
የባቲሜትሪክ ካርታ እንዴት ይነበባል
የኮንቱር ልዩነትን ይለዩ
በእያንዳንዱ መስመር መካከል ያለውን የጥልቀት ልዩነት በካርታው መመሪያ ላይ ይመልከቱ፣ አብዛኛውን ጊዜ በሜትር የተቀመጠ።
የመስመሮችን ርቀት በመመልከት ተዳፋቱን ያንብቡ
የተቀራረቡ መስመሮች ቁልቁል ተዳፋትን ያሳያሉ፣ ሰፋ ያሉ መስመሮች ደግሞ ለስላሳ ተዳፋትን ያሳያሉ።
የመሬት ቅርጾችን ለመከታተል መስመሮቹን ይከተሉ
የተዘጋጉ የኮንቱር ክበቦች ብዙውን ጊዜ ከውሃ በታች ያሉ ጉድጓዶችን ወይም ኮረብታዎችን ያሳያሉ።
የጥልቀት መነሻ ደረጃን ያረጋግጡ
ሁሉም ጥልቀቶች ከተወሰነ የውሃ ወለል መነሻ አንጻር ስለሚሰሉ ይህንን መረዳት አስፈላጊ ነው።
ከቀለም ደረጃዎች ጋር ያወዳድሩ
ብዙ ካርታዎች ከኮንቱር መስመሮች ጎን ለጎን የቀለም ደረጃዎችን ይጠቀማሉ፣ ጥቁር ሰማያዊ አብዛኛውን ጊዜ ጥልቅ ቦታን ያሳያል።
ሁልጊዜ የባቲሜትሪክ ካርታ የሚጠቀምበትን የቁመት መነሻ ደረጃ ያረጋግጡ። ተመሳሳይ ጥልቀት በተለያየ የመነሻ ነጥብ ምክንያት የተለየ ቁጥር ሊያሳይ ይችላል።
የኮንቱር መስመር ጥልቀትን ብቻ አያሳይም። የውሃው ወለል በምን ያህል ፍጥነት እንደሚቀየር ይነግርዎታል።
የባቲሜትሪክ ካርታዎችን መጠቀም
ለመርከብ ጉዞ፣ ለኢንጂነሪንግ ዲዛይን ወይም ለአካባቢ ክትትል፣ እነዚህን ካርታዎች ማንበብ መረጃን ወደ ተግባራዊ እውቀት ይለውጣል። የእኛ በድሮን ቅኝት ቡድን ለእያንዳንዱ ፕሮጀክት ግልጽ እና ትክክለኛ የባቲሜትሪክ ካርታዎችን ያቀርባል።
ለፕሮጀክትዎ የባቲሜትሪክ ካርታ ያስፈልግዎታል?
ስለ የውሃ አካልዎ ይንገሩን እና ፕሮጀክትዎ ምን ያህል የኮንቱር ዝርዝር እንደሚያስፈልገው እንရှင်းራለን።
ተደጋግመው የሚጠየቁ ጥያቄዎች
የኮንቱር መስመር ከውሃ በታች እኩል ጥልቀት ያላቸውን ነጥቦች ያገናኛል፣ ልክ በመሬት ላይ ከፍታ መስመሮች እንደሚያደርጉት።
የተቀራረቡ መስመሮች ቁልቁል የውሃ ውስጥ ተዳፋትን ያሳያሉ፣ ሰፋ ያሉ መስመሮች ደግሞ ለስላሳ ተዳፋትን ያሳያሉ።
የኮንቱር ልዩነት በተከታታይ መስመሮች መካከል ያለው የተወሰነ የጥልቀት ልዩነት ነው።
የቁመት መነሻ ደረጃ ሁሉም የጥልቀት ልኬቶች የሚሰሉበት መነሻ የውሃ ወለል ደረጃ ነው።
የተዘጋጉ ክበቦች ብዙውን ጊዜ ከውሃ በታች ያሉ ጉድጓዶችን ወይም ኮረብታዎችን ያሳያሉ።
የቀለም ደረጃዎች ከመስመሮቹ ጎን ለጎን ፈጣን የእይታ መረጃን ይሰጣሉ።
ሶፍትዌር የተለኩ የጥልቀት ነጥቦችን በማገናኘት ለስላሳ የኮንቱር መስመሮችን ይስላል።
አዎ፣ ኦፊሴላዊ የባህር ካርታዎች ለደህንነቱ የተጠበቀ የመርከብ ጉዞ በባቲሜትሪክ መረጃ ላይ ይመረኮዛሉ።
አነስተኛ ልዩነት አነስተኛ ዝርዝሮችን ያሳያል ነገር ግን ተጨማሪ መረጃ ይፈልጋል፤ ትልቅ ልዩነት ደግሞ ካርታውን ያቃልላል።
የተወሰኑ የሃይድሮግራፊ እና GIS ሶፍትዌሮች የሶናር መረጃን ወደ ኮንቱር ካርታዎች ይለውጣሉ።
ይህ መስመር ለፕሮጀክት መሪዎች የተጠበቀ ነው። እባክዎን ለትምህርት፣ ስልጠና ወይም የስራ ጥያቄዎች አይገናኙ።